With reference to the water on the planet Earth, consider the following statements: 1. The amount of water in the rivers and lakes is more than the amount of groundwater. 2. The amount of water in polar ice caps and glaciers is more than the amount of groundwater. Which of the statements given above is/are correct?
Contents17
- A1 only
- B2 only
- CBoth 1 and 2
- DNeither 1 nor 2
Show answer
Answer: (B) 2 only
Statement 1 is wrong:
Groundwater is far more abundant than surface water in rivers and lakes.
Of all freshwater on Earth, about 30% is groundwater while less than 1% is in rivers and lakes.
Statement 2 is correct:
Polar ice caps and glaciers hold about 69% of all freshwater, which is greater than groundwater (about 30%).
Only
Statement 2 is correct.
Answer: (b).
Groundwater contains about 30% of all freshwater on Earth, while rivers and lakes contain less than 1%, making groundwater roughly 30 times more abundant than surface water.
Ice caps and glaciers hold about 69% of all freshwater, more than double the amount stored as groundwater.
UPSC is testing whether students know the actual distribution of Earth's freshwater reserves, not just which sources exist.
Global Water Distribution
Geography amount of water rivers and lakes groundwater polar ice caps glaciers
Global Water Distribution: Freshwater Sources & UPSC Facts
Ice caps & glaciers hold 69% of all freshwater on Earth
Groundwater accounts for 30% of all freshwater
Rivers & lakes contain less than 1% of all freshwater
Oceans contain 97.5% of all water on Earth
The Water Reality
Earth's water exists in vastly unequal proportions. While we see rivers and lakes daily, they represent tiny fractions of global water. The real story lies in hidden groundwater and frozen ice that dwarf all surface freshwater combined.
Freshwater Distribution
Water Source | % of Total Freshwater | Accessibility | Key Facts |
|---|---|---|---|
Ice caps & Glaciers | 69% | Mostly inaccessible | Antarctica, Greenland, mountain glaciers |
Groundwater | 30% | Wells, springs | Aquifers, water table, fossil water |
Surface Water | 1% | Directly accessible | Rivers, lakes, streams, wetlands |
Atmosphere | <0.1% | Precipitation | Water vapor, clouds |
Total Earth Water
Water Type | % of Total Water | Volume | Salinity |
|---|---|---|---|
Oceans | 97.5% | Largest reservoir | Salt water |
Freshwater | 2.5% | All ice + groundwater + surface | Fresh water |
Other saline | <0.1% | Salt lakes, inland seas | Salt water |
Question Connection
This 2021 UPSC question tested the counter-intuitive fact that groundwater vastly exceeds surface water but ice dominates groundwater. Statement 1 was the trap - students who think visually (seeing rivers everywhere) miss that groundwater is 30 times larger than all rivers and lakes combined.
Trap: Assuming surface water (rivers/lakes) > groundwater because we see it daily
Common error: Confusing total water (97.5% oceans) with freshwater distribution
Statement reversal: UPSC often swaps groundwater vs surface water quantities
Ice misconception: Underestimating that ice holds 69% of all freshwater
Groundwater vs Surface Water
Geography groundwater rivers and lakes
Groundwater vs Surface Water: Sources, Storage & Significance
Groundwater is 30 times larger than all surface freshwater
Surface water includes rivers, lakes, streams, wetlands
Aquifers store groundwater in rock and soil layers
Key Comparisons
Aspect | Groundwater | Surface Water |
|---|---|---|
Volume | 30% of freshwater | <1% of freshwater |
Storage | Aquifers, soil pores | Rivers, lakes, reservoirs |
Accessibility | Wells, borewells, springs | Direct collection, pumping |
Recharge | Rainfall infiltration, percolation | Direct precipitation, runoff |
Movement | Slow (years to millennia) | Fast (days to months) |
Quality | Usually filtered, cleaner | More prone to pollution |
Groundwater System
# Groundwater
## Storage Zones
- Unsaturated Zone
- Water Table
- Saturated Zone
- Aquifers
## Aquifer Types
- Unconfined
- Confined
- Artesian
- Perched
## Recharge Sources
- Rainfall
- River Seepage
- Irrigation Return
- Artificial Recharge
## Extraction Methods
- Hand Pumps
- Tube Wells
- Open Wells
- Springs
Groundwater Zones
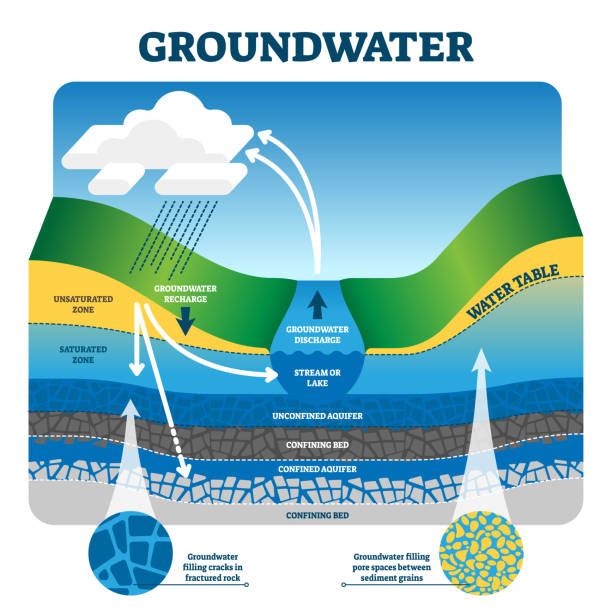
Source: iStock — 300+ Groundwater Diagram Stock Photos, Pictures & Royalty-Free ... · www.istockphoto.com
Polar Ice & Glaciers
Geography polar ice caps glaciers
Polar Ice & Glaciers: Earth's Largest Freshwater Reservoir
Ice caps & glaciers store 69% of all freshwater on Earth
Antarctica holds 90% of world's ice
Greenland contains 8% of global ice
If all ice melted, sea levels would rise by 70+ meters
Major Ice Reserves
Ice Body | % of Global Ice | % of Freshwater | Area Coverage | Average Thickness |
|---|---|---|---|---|
Antarctic Ice Sheet | 90% | ~62% | 14 million km² | 2+ km |
Greenland Ice Sheet | 8% | ~5.5% | 1.7 million km² | 1.5+ km |
Mountain Glaciers | 1% | ~0.7% | Global distribution | Variable |
Permafrost/Other | 1% | ~0.7% | Arctic regions | Variable |
Types of Ice Bodies
# Frozen Water
## Ice Sheets
- Antarctica
- Greenland
- Continental scale
- Millions of years old
## Ice Caps
- Smaller than ice sheets
- Arctic islands
- Mountain tops
- Vatnajökull (Iceland)
## Glaciers
- Valley glaciers
- Cirque glaciers
- Piedmont glaciers
- Tidewater glaciers
## Other Ice
- Sea ice
- Lake ice
- Permafrost
- Snow cover
Global Ice Distribution
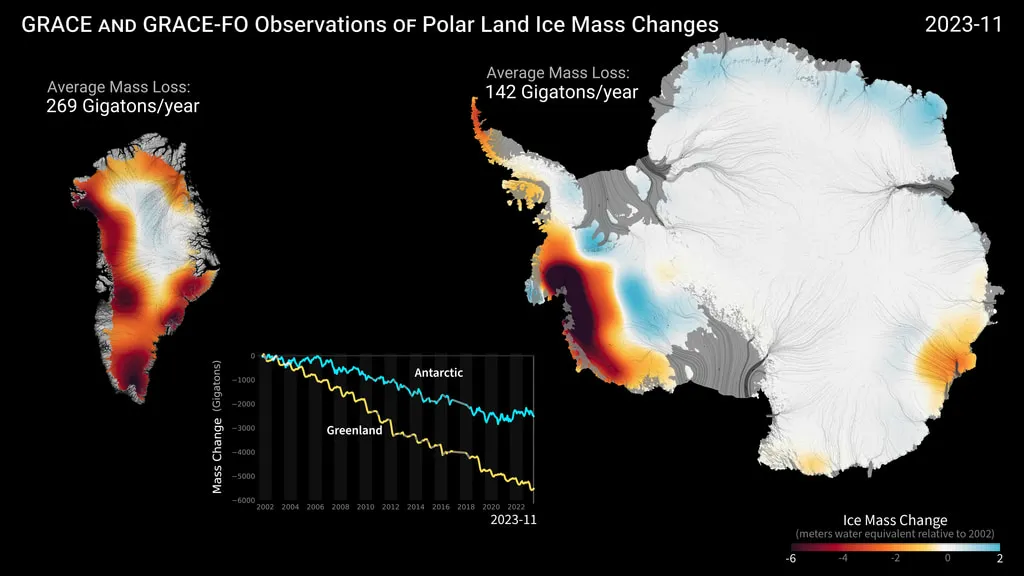
Source: National Snow and Ice Data Center — Why Ice Sheets Matter | National Snow and Ice Data Center · nsidc.org
Don't confuse: Sea ice (frozen ocean) vs land ice (freshwater source)
Volume trap: Ice volume is huge but mostly inaccessible for human use
Statement swap: UPSC may reverse Antarctica vs Greenland ice percentages
Freshwater vs Total Water
Geography amount of water
Freshwater vs Total Water: The Scarcity Reality
Oceans contain 97.5% of all water on Earth
Freshwater is only 2.5% of total water
Accessible freshwater is less than 1% of total water
The Big Picture
Earth appears water-rich from space, but this is misleading. Salt water dominates - if all Earth's water fit in 100 liters, only 2.5 liters would be fresh, and less than 1 liter would be accessible for human use.
Water Breakdown
%%{init: {"flowchart": {"wrappingWidth": 460}}}%%
flowchart TD
  s1["`****100% Total Water****
All water on Earth`"]
  s2["`****97.5% Salt Water****
Oceans, salt lakes, saline groundwater`"]
  s3["`****2.5% Freshwater****
All non-saline water`"]
  s4["`****1.75% Frozen****
Ice caps, glaciers (69% of freshwater)`"]
  s5["`****0.75% Liquid Freshwater****
Groundwater + surface water (30% + 1%)`"]
  s6["`****<0.025% Accessible****
Rivers, lakes, shallow groundwater`"]
  s1 --> s2
  s2 --> s3
  s3 --> s4
  s4 --> s5
  s5 --> s6
Water Accessibility
Water Category | % of Total | Human Use | Examples |
|---|---|---|---|
Salt Water | 97.5% | Desalination only | Oceans, salt lakes |
Frozen Freshwater | 1.75% | Mostly unusable | Antarctica, Greenland |
Deep Groundwater | 0.6% | Difficult/expensive | Fossil aquifers |
Accessible Freshwater | <0.1% | Direct use | Rivers, lakes, shallow wells |
Context trap: Questions may ask about freshwater % without clarifying if it's % of total water or % of freshwater
Decimal confusion: 2.5% total freshwater vs 0.025% accessible freshwater
Visual bias: Earth looks water-rich but 97.5% is salty and unusable