India is regarded as a country with "Demographic Dividend". This is due to
Contents10
- AIts high population in the age group below 15 years
- BIts high population in the group of 15-64 years
- CIts high population in the age group above 65 years
- DIts high total population
Show answer
Answer: (B) Its high population in the group of 15-64 years
India's 'Demographic Dividend' comes from having a large population in the WORKING-AGE GROUP (15-64 years).
This means more people can work, earn, save, and invest → potential for high economic growth.
The concept: When a country has MORE working-age people relative to dependents (children under 15 + elderly above 65), it has a 'window of opportunity' for rapid economic growth.
India's median age is about 28 years — one of the youngest in the world.
Option (a) — high population below 15 = more DEPENDENTS, not dividend (they need education, healthcare but don't produce yet).
Option (c) — high population above 65 = aging population = demographic BURDEN (like Japan, Germany).
Option (d) — high TOTAL population alone isn't a dividend; it could be a liability if most people are too young or too old to work.
Key insight: Demographic dividend is a TIME-LIMITED opportunity.
India must create jobs and skill its youth before this population ages — or the dividend becomes a disaster.
Demographic dividend occurs when the working-age population (15-64 years) is large relative to dependents, creating potential for rapid economic growth through higher savings and investment.
India's median age of around 28 years makes it one of the world's youngest populations, but this advantage is time-limited and requires job creation before the population ages.
The question tests understanding that population size alone is not beneficial - the age structure and dependency ratio determine whether population is an asset or burden.
Demographic Dividend Concept
Indian Economy Demographic Dividend 15-64 years working-age
Demographic Dividend: Working-Age Population & Economic Growth
Demographic dividend = large working-age population (15-64 years) relative to dependents
Creates potential for high economic growth through more workers, earners, savers
Time-limited opportunity - must create jobs before population ages
India's median age is approximately 28 years - among world's youngest
Demographic dividend occurs when a country has a large share of its population in the working-age group (15-64 years) compared to dependents (children under 15 + elderly above 65). This creates a 'window of opportunity' for rapid economic growth.
Age Groups & Economic Impact
Age Group | Economic Role | Impact on Growth | India's Status |
|---|---|---|---|
Below 15 years | Dependents (need education, healthcare) | Burden - consume but don't produce | Declining share |
15-64 years | Working-age population | Dividend - work, earn, save, invest | Large share (~65%) |
Above 65 years | Elderly dependents (need pensions, healthcare) | Burden - aging population costs | Still low (~6%) |
How Demographic Dividend Works
%%{init: {"flowchart": {"wrappingWidth": 460}}}%%
flowchart TD
  s1["`**Large Working-Age Population**
More people aged 15-64 years`"]
  s2["`**Increased Labor Force**
More workers available for production`"]
  s3["`**Higher Savings & Investment**
Working population earns and saves more`"]
  s4["`**Economic Growth**
Increased productivity and capital formation`"]
  s5["`**Window Closes**
Population ages, dependency ratio rises again`"]
  s1 --> s2
  s2 --> s3
  s3 --> s4
s4 --> s5Trap: High population below 15 years = more dependents, not dividend
Trap: High population above 65 years = aging burden (like Japan), not dividend
Trap: High total population alone doesn't guarantee dividend - age structure matters
Confusion: Demographic dividend is about age structure, not population size
India's Demographic Profile
Indian Economy India
India's Demographic Profile & Dividend Opportunity
India has world's largest youth population - over 65% in working age
Demographic dividend window available till approximately 2040-2050
Challenge: Create 12-15 million jobs annually to harness dividend
Median age ~28 years vs global average of 30+ years
India is experiencing its demographic dividend phase with approximately 65% of population in working-age group. This makes India one of the 'youngest' major economies globally, creating both opportunity and challenge.
India vs Other Countries
Country | Median Age (approx.) | Demographic Status | Economic Implication |
|---|---|---|---|
India | 28 years | Demographic dividend phase | Growth opportunity |
China | 38 years | Dividend phase ending | Aging concerns rising |
Japan | 48 years | Aging society | Demographic burden |
Germany | 46 years | Aging population | Labor shortage issues |
India's Key Challenges
Job Creation: Need to generate 12-15 million jobs annually to absorb new workforce
Skills Development: Large working-age population needs relevant skills for modern economy
Time Sensitivity: Dividend window closes as population ages - estimated till 2040-2050
Regional Variation: Southern states aging faster than northern states
India's Population Pyramid
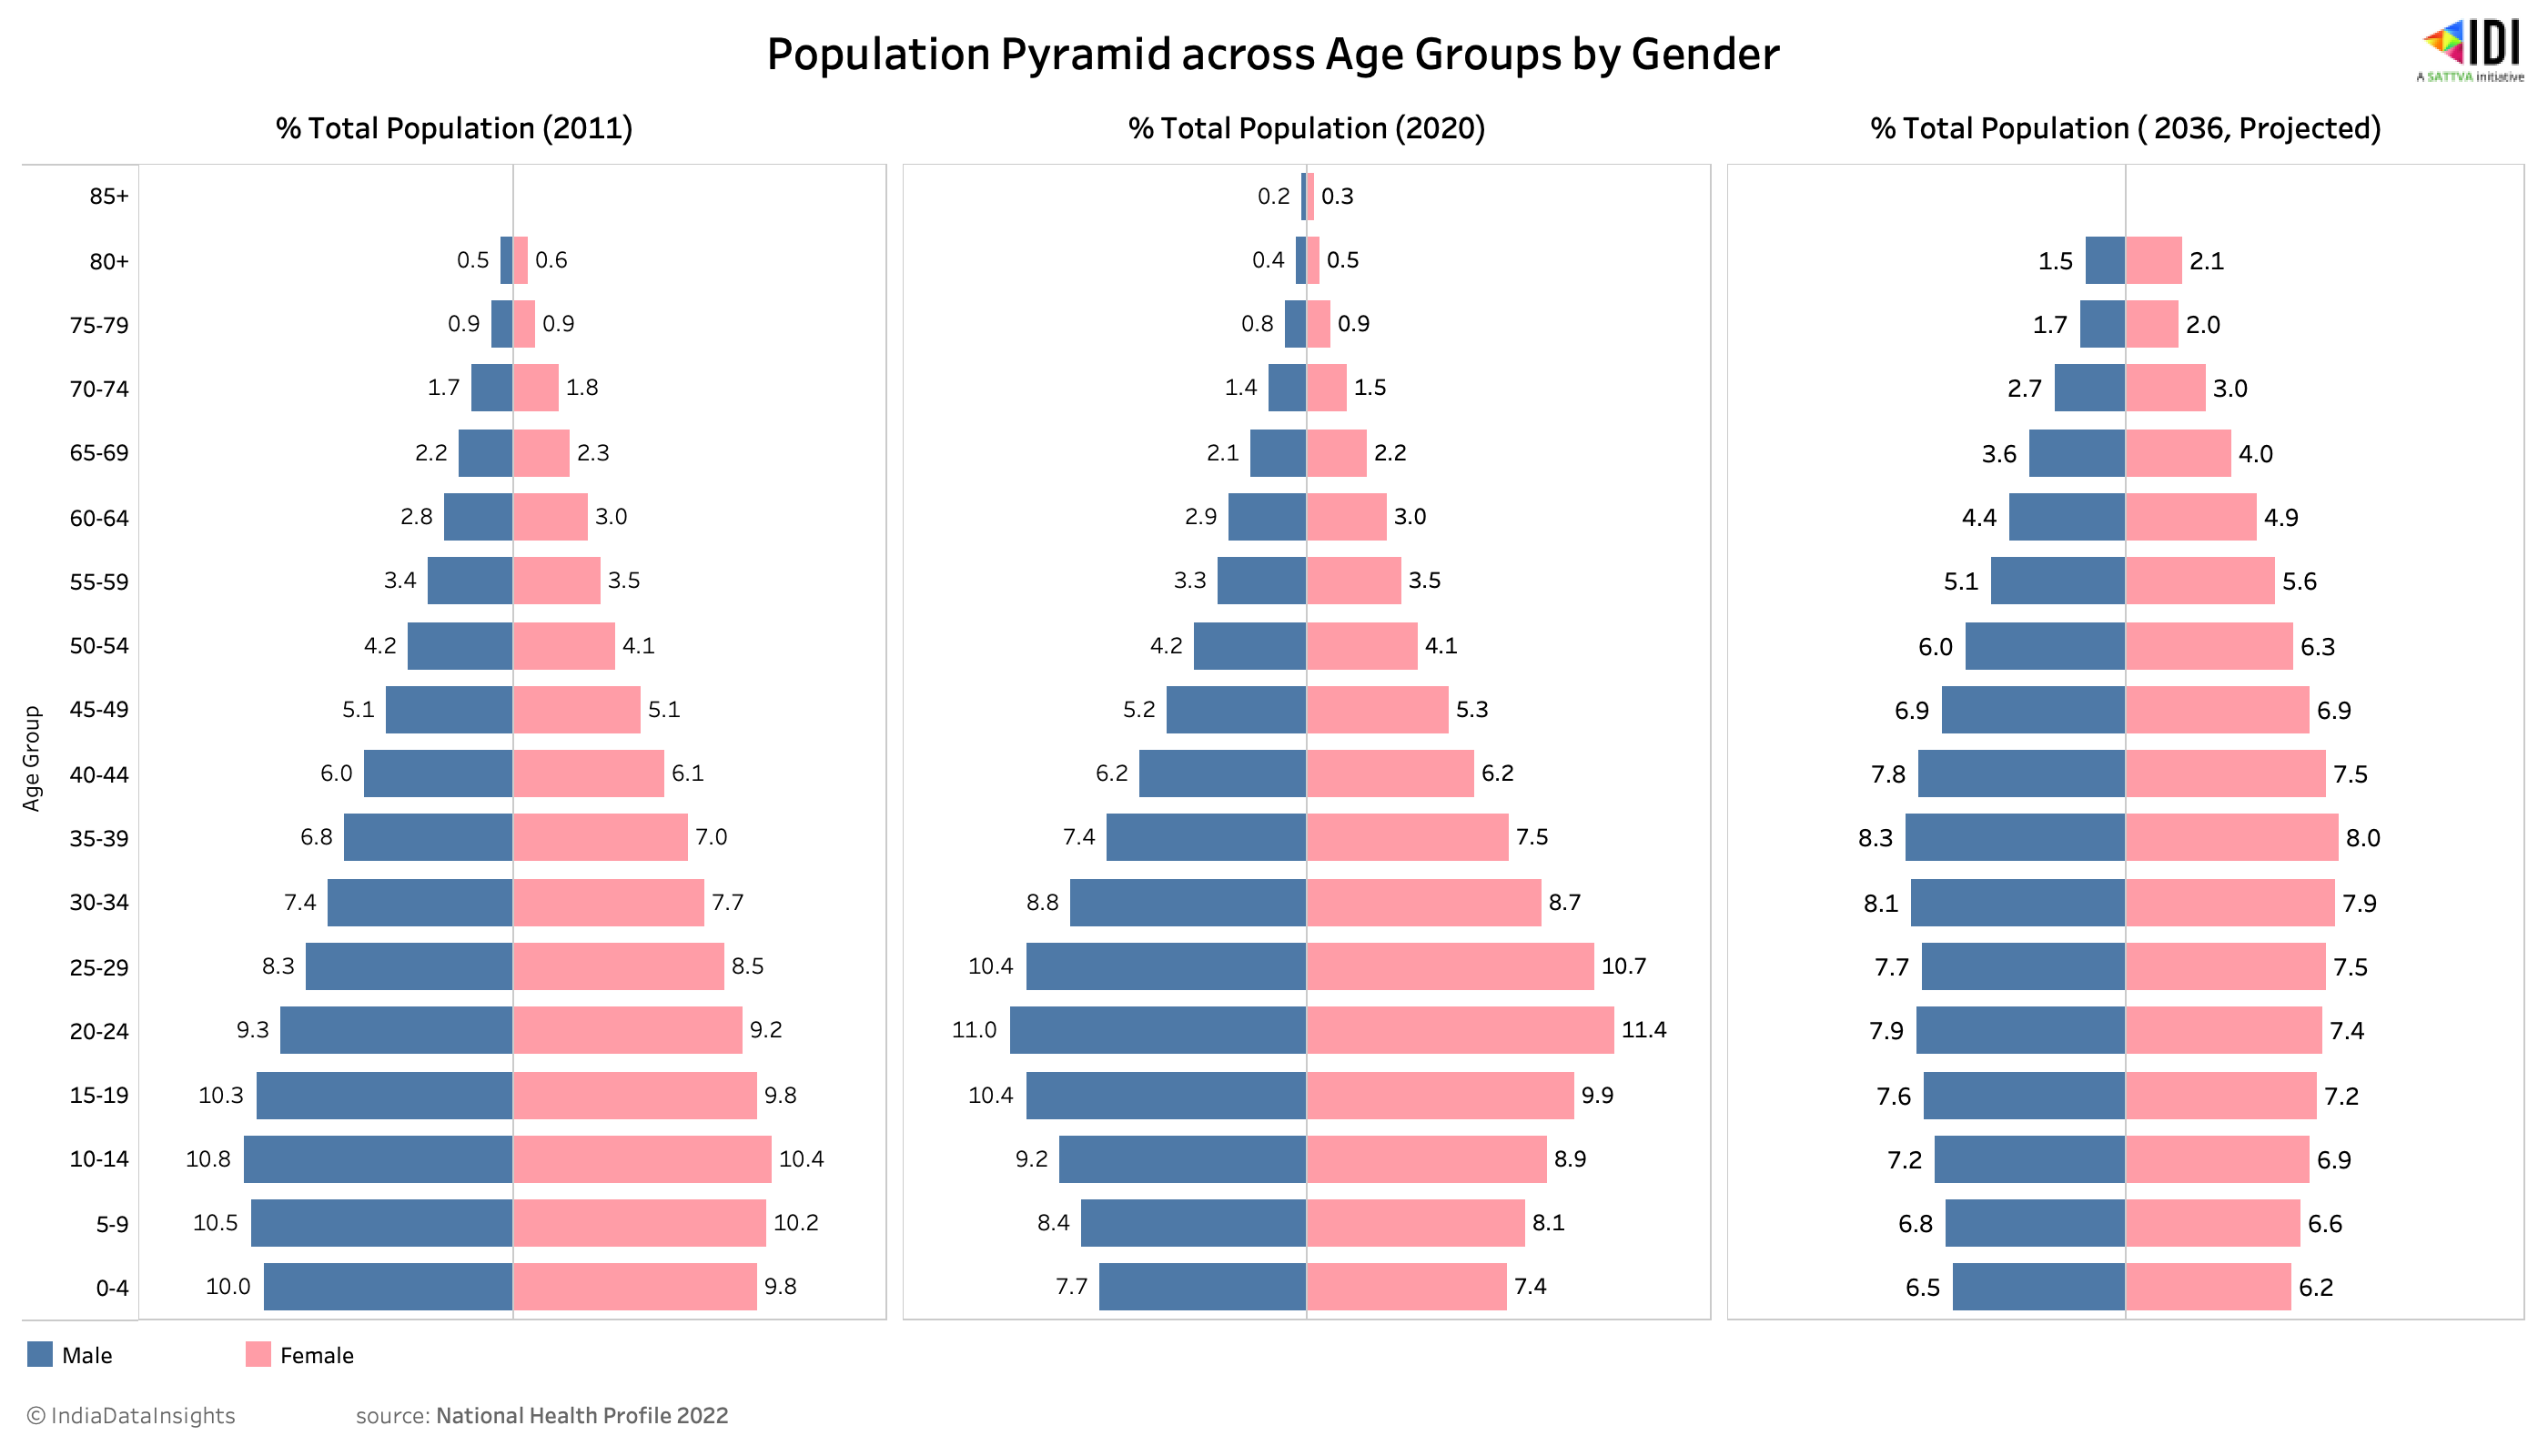
Source: IDR — The impact of demographic shifts on India's health ... · idronline.org
Remember: India's advantage is working-age share, not total population
Timing: Demographic dividend is time-limited opportunity, not permanent advantage
Policy Link: Dividend requires supportive policies - education, skill development, job creation
Dependency Ratio Analysis
Indian Economy dependents
Dependency Ratio: Key to Understanding Demographic Dividend
Dependency ratio = (Population under 15 + over 65) / Working-age population
Lower dependency ratio = more workers per dependent = economic advantage
India's dependency ratio declining due to falling birth rates
Sweet spot: dependency ratio below 50-60% indicates dividend phase
Dependency ratio measures how many dependents (children + elderly) each working-age person must support. A declining dependency ratio creates the demographic dividend opportunity.
Types of Dependency
Type | Age Group | Economic Impact | India's Trend |
|---|---|---|---|
Child Dependency | Under 15 years | Education, healthcare costs | Declining (falling birth rate) |
Old-Age Dependency | Over 65 years | Pension, medical costs | Rising slowly (better healthcare) |
Total Dependency | Under 15 + Over 65 | Combined burden on workers | Net declining currently |
Dependency Ratio Transition
%%{init: {"flowchart": {"wrappingWidth": 460}}}%%
flowchart TD
  s1["`**High Birth Rate Phase**
Many children, high child dependency ratio`"]
  s2["`**Declining Birth Rate**
Fewer children born, child dependency falls`"]
  s3["`**Demographic Dividend**
Low total dependency, large working-age population`"]
  s4["`**Population Aging**
Old-age dependency rises, dividend phase ends`"]
  s5["`**Aging Society**
High old-age dependency, economic burden`"]
  s1 --> s2
  s2 --> s3
  s3 --> s4
s4 --> s5Formula confusion: Dependency ratio = dependents/workers, not workers/dependents
Direction: Lower dependency ratio is better for economic growth
Components: Both child AND elderly dependencies matter for total ratio