Which one of the following is the correct sequence of a food chain?
Contents14
- ADiatoms-Crustaceans-Herrings
- BCrustaceans-Diatoms-Herrings
- CDiatoms-Herrings-Crustaceans
- DCrustaceans-Herrings-Diatoms
Show answer
Answer: (A) Diatoms-Crustaceans-Herrings
A food chain always flows:
Producer → Primary Consumer → Secondary Consumer.
Diatoms are microscopic algae (producers — they photosynthesise).
Crustaceans (like krill, copepods) are tiny animals that feed on diatoms (primary consumers).
Herrings are small fish that eat crustaceans (secondary consumers).
So the correct chain is:
Diatoms → Crustaceans → Herrings.
Any sequence that puts consumers before producers is wrong.
This is an aquatic/marine food chain example.
Remember: food chains ALWAYS start with a producer (plants/algae).
Food chains always start with producers (plants or algae that make their own food through photosynthesis) and flow to primary consumers, then secondary consumers.
This tests the core ecological principle that energy flows in one direction - from producers to herbivores to carnivores - which is fundamental to understanding all ecosystem dynamics.
Food Chains & Energy Flow
Environment food chain sequence
Food Chains: Structure, Flow & UPSC Patterns
Food chains ALWAYS start with producers (plants/algae) and flow upward
Energy flows: Producer → Primary Consumer → Secondary Consumer → Tertiary Consumer
Each level is called a trophic level — position in the food chain
Only 10% energy transfers between trophic levels (10% Rule)
A food chain shows the linear flow of energy from one organism to another. The direction is fixed by nature's energy transfer rules — always from producers upward to consumers.
Trophic Levels Structure
Trophic Level | Type | Function | Examples |
|---|---|---|---|
T1 | Producers | Make food via photosynthesis | Plants, algae, diatoms |
T2 | Primary Consumers | Eat producers (herbivores) | Crustaceans, deer, grasshoppers |
T3 | Secondary Consumers | Eat primary consumers | Herrings, frogs, small carnivores |
T4 | Tertiary Consumers | Eat secondary consumers | Sharks, eagles, top predators |
Energy Flow Direction
%%{init: {"flowchart": {"wrappingWidth": 460}}}%%
flowchart TD
  s1["`****Producers** (T1)**
Capture solar energy via photosynthesis`"]
  s2["`****Primary Consumers** (T2)**
Eat producers, get 10% of energy`"]
  s3["`****Secondary Consumers** (T3)**
Eat primary consumers, get 1% of original energy`"]
  s4["`****Tertiary Consumers** (T4)**
Eat secondary consumers, get 0.1% of original energy`"]
  s1 --> s2
  s2 --> s3
  s3 --> s4
In the given question, Diatoms → Crustaceans → Herrings represents a classic marine food chain. Any other sequence violates energy flow laws.
Trap: Never start a food chain with consumers — producers always come first
Trap: Don't confuse food chain (linear) with food web (interconnected networks)
Trap: Crustaceans before diatoms violates basic energy flow — herbivores can't exist without plants
Marine Food Chain Organisms
Environment Diatoms Crustaceans Herrings
Diatoms, Crustaceans & Herrings: Marine Ecosystem Roles
Diatoms are microscopic algae — primary producers of marine ecosystems
Crustaceans (krill, copepods) are tiny animals that graze on diatoms
Herrings are small fish that feed on crustaceans and zooplankton
Marine Organisms Comparison
Organism | Type | Size | Role in Food Chain | Key Features |
|---|---|---|---|---|
Diatoms | Microscopic algae | 0.002-0.2 mm | Producer (T1) | Glass-like cell walls, photosynthesis |
Crustaceans | Small animals | 1-30 mm | Primary Consumer (T2) | Krill, copepods, shrimp-like |
Herrings | Small fish | 20-38 cm | Secondary Consumer (T3) | Schooling fish, filter feeders |
Diatoms — Ocean's Primary Producers
Phytoplankton category — drift freely in water, cannot swim against currents
Produce 20% of world's oxygen — more than Amazon rainforest
Glass-like shells made of silica — create diatomaceous earth when they die
Form base of most marine food chains globally
Crustaceans — Key Marine Grazers
Zooplankton when small — includes copepods, krill, tiny shrimps
Filter feeders — strain diatoms and other phytoplankton from water
Antarctic krill supports whales, seals, penguins in Southern Ocean
Bridge gap between microscopic producers and larger fish
Marine Food Chain Visual
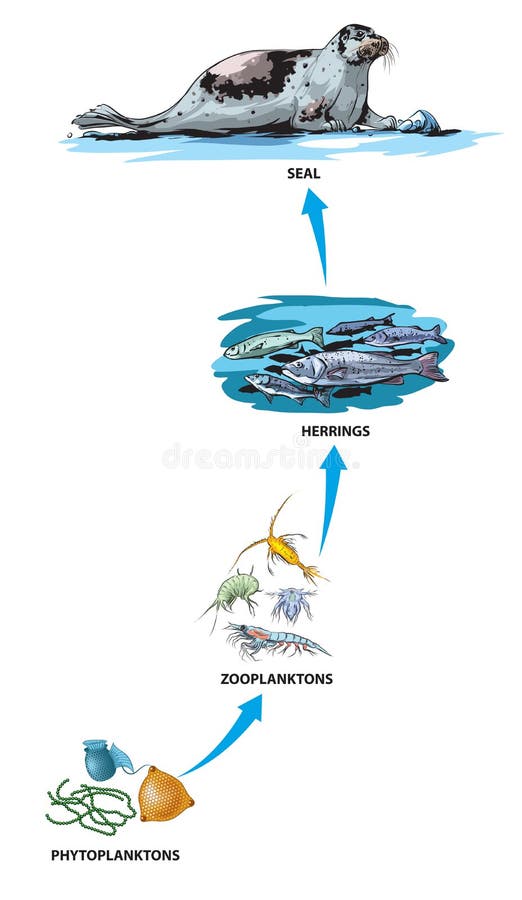
Source: Dreamstime.com — Sea Animal Food Chain Stock Illustrations – 236 Sea Animal Food ... · www.dreamstime.com
Food Chains vs Food Webs
Environment
Food Chains vs Food Webs: Structure & Complexity
Food chain = single linear pathway of energy transfer
Food web = interconnected network of multiple food chains
Real ecosystems have food webs, not isolated food chains
Key Differences
Aspect | Food Chain | Food Web |
|---|---|---|
Structure | Linear, single pathway | Network, multiple pathways |
Complexity | Simple, easy to study | Complex, realistic |
Stability | Unstable — one break affects all | Stable — alternative pathways exist |
Examples | Grass → Rabbit → Fox | Multiple chains interconnected |
UPSC Focus | Tests sequence knowledge | Tests ecosystem understanding |
Food Web Components
# Food Web
## Multiple Producers
- Different plants
- Various algae
- Diverse autotrophs
## Varied Consumers
- Herbivores
- Carnivores
- Omnivores
- Decomposers
## Alternative Pathways
- Backup food sources
- Seasonal variations
- Population stabilityTrap: UPSC asks for food chain sequence — stick to linear flow, ignore web complexity
Trap: Don't add decomposers to simple food chain questions — they're web components
Ecological Pyramids & Energy Transfer
Environment
Ecological Pyramids: Energy, Biomass & Numbers
10% Rule: Only 10% energy transfers between trophic levels
Energy pyramid is always upright — energy decreases upward
Biomass pyramid usually upright, but can be inverted in aquatic systems
Ecological pyramids show quantitative relationships between trophic levels. The 10% Rule explains why food chains rarely exceed 4-5 levels — insufficient energy remains for higher consumers.
Types of Ecological Pyramids
Pyramid Type | What It Shows | Shape | Example |
|---|---|---|---|
Energy | Energy flow between levels | Always upright | 10,000 → 1,000 → 100 → 10 kcal |
Biomass | Total weight at each level | Usually upright | Inverted in oceans (phytoplankton) |
Numbers | Individual organisms count | Variable | Inverted: 1 tree → 1000 insects → 10 birds |
Energy Transfer (10% Rule)
%%{init: {"flowchart": {"wrappingWidth": 460}}}%%
flowchart TD
  s1["`****Producers**: 10,000 kcal**
Solar energy captured via photosynthesis`"]
  s2["`****Primary Consumers**: 1,000 kcal**
90% lost as heat, movement, metabolism`"]
  s3["`****Secondary Consumers**: 100 kcal**
Again 90% energy lost`"]
  s4["`****Tertiary Consumers**: 10 kcal**
Very little energy remains`"]
  s1 --> s2
  s2 --> s3
s3 --> s4Trap: Energy pyramid is NEVER inverted — always decreases upward
Trap: Biomass pyramid CAN be inverted in aquatic ecosystems (fast-reproducing phytoplankton)