Which one of the following is the correct sequence of ecosystems in the order of decreasing productivity?
Contents12
- AOceans, lakes, grasslands, mangroves
- BMangroves, oceans, grasslands, lakes
- CMangroves, grasslands, lakes, oceans
- DOceans, mangroves, lakes, grasslands
Show answer
Answer: (C) Mangroves, grasslands, lakes, oceans
Net primary productivity (in g/m²/year) for each ecosystem:
Mangroves — approximately 2,500 g/m²/year (highest among the options, due to nutrient-rich sediments, tidal flushing, and warm tropical conditions).
Grasslands — approximately 500 g/m²/year.
Lakes — approximately 500 g/m²/year (comparable to grasslands, but slightly lower on average).
Open Oceans — approximately 125 g/m²/year (surprisingly low per unit area despite being the largest ecosystem by area, because most of the open ocean is nutrient-poor — a 'biological desert').
Many students assume oceans are highly productive because they are vast, but productivity is measured PER UNIT AREA, and most open ocean water lacks the nutrients needed for high productivity.
Coastal and upwelling zones are productive, but the vast open ocean is not.
So the decreasing order is: Mangroves > Grasslands > Lakes > Oceans.
Mangroves have the highest productivity per unit area among these ecosystems at approximately 2,500 g/m²/year due to nutrient-rich sediments and tidal flushing, while open oceans have surprisingly low productivity at only 125 g/m²/year despite their vast size.
The trap here is confusing total productivity with productivity per unit area - most open ocean is nutrient-poor 'biological desert' despite oceans covering 70% of Earth's surface.
Students must memorize the approximate NPP values for major ecosystems and understand that coastal zones are productive while open oceans are not.
Net Primary Productivity (NPP)
Environment productivity decreasing productivity
Net Primary Productivity: Definition, Measurement & UPSC Applications
NPP = rate at which producers convert solar energy into biomass after their own respiration
Measured in g/m²/year — productivity per unit area, not total production
Mangroves have highest NPP (~2,500), open oceans lowest (~125) among major ecosystems
Net Primary Productivity (NPP) measures how much biomass producers create per unit area per year, after subtracting what they use for their own respiration. UPSC tests this concept by asking students to rank ecosystems — the key trap is confusing total production with productivity per area.
Key Concepts
GPP (Gross Primary Productivity) = total photosynthesis by producers
NPP = GPP - Plant Respiration — the net energy available to herbivores
Units: grams per square meter per year (g/m²/year) or kilograms per hectare
Depends on sunlight, temperature, water availability, and nutrient supply
Higher NPP supports more complex food webs and greater biodiversity
Area vs Total: Oceans have vast total production but low productivity per m² — UPSC tests per-unit-area ranking
Mangroves surprise: Students underestimate mangrove productivity — it's the highest due to nutrient-rich conditions
Desert confusion: Deserts have very low NPP despite high sunlight — water and nutrients are limiting factors
Ecosystem Productivity Rankings
Environment mangroves grasslands lakes oceans
Ecosystem Productivity Rankings: The UPSC-Tested Hierarchy
Correct decreasing order: Mangroves > Grasslands > Lakes > Oceans
Mangroves top the list at ~2,500 g/m²/year due to ideal tropical conditions
Open oceans are least productive at ~125 g/m²/year — nutrient-poor 'biological deserts'
NPP Rankings
Ecosystem | NPP (g/m²/year) | Why This Level? | UPSC Trap |
|---|---|---|---|
Mangroves | ~2,500 | Nutrient-rich sediments + tidal flushing + tropical warmth | Students underestimate |
Grasslands | ~500 | Moderate conditions, seasonal growth patterns | Seems too low vs forests |
Lakes | ~400-500 | Variable nutrients, limited by depth/temperature | Confused with rivers |
Open Oceans | ~125 | Nutrient-poor surface waters, vast 'deserts' | Students think size = productivity |
Why This Ranking?
Mangroves excel: Constant nutrient supply from land runoff + tidal mixing + year-round tropical growth
Grasslands moderate: Seasonal limitations but efficient C4 photosynthesis in tropical varieties
Lakes variable: Productivity depends on nutrient input — eutrophic lakes higher, oligotrophic lower
Oceans paradox: 70% of Earth's surface but mostly nutrient-limited — only coastal/upwelling zones are highly productive
Global Productivity Map
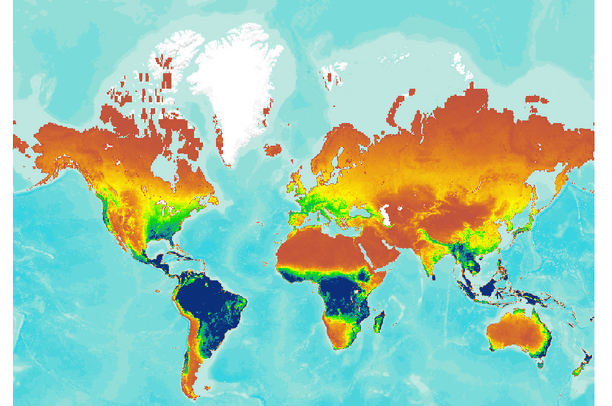
Source: Data Basin — Global Patterns in Net Primary Productivity (NPP in g C/cell ... · databasin.org
Size trap: Students pick oceans first because they're vast — but NPP is per unit area, not total
Forest assumption: Students expect forests in the options — focus on the ecosystems actually given
Lake overestimate: Lakes seem productive but are limited by nutrients and seasonal ice cover
Mangrove surprise: Wetlands like mangroves outproduce most terrestrial ecosystems — memorize this fact
Mangrove Ecosystems
Environment mangroves
Mangrove Ecosystems: World's Most Productive Coastal Habitat
Highest NPP among all ecosystems at ~2,500 g/m²/year
Found in tropical/subtropical coasts between land and sea
India has ~4,900 km² of mangroves, mainly in Sundarbans and western coast
Mangroves are salt-tolerant trees and shrubs that thrive in tropical coastal areas where rivers meet the sea. Their exceptional productivity makes them crucial nurseries for marine life and carbon sinks for climate regulation.
Why Mangroves Are So Productive
Tidal flushing brings fresh nutrients twice daily from both land and sea
Warm tropical climate enables year-round photosynthesis without seasonal dormancy
Nutrient-rich sediments from river deposits provide abundant nitrogen and phosphorus
Specialized root systems (pneumatophores) maximize nutrient and oxygen uptake
Multiple vegetation layers from canopy to understory capture maximum sunlight
Mangrove Distribution in India
# Indian Mangroves
## East Coast
- Sundarbans (West Bengal)
- Godavari Delta (Andhra)
- Mahanadi Delta (Odisha)
- Cauvery Delta (Tamil Nadu)
## West Coast
- Mumbai Creek
- Goa Estuaries
- Karnataka Coast
- Kerala Backwaters
## Islands
- Andaman & Nicobar
- Lakshadweep (limited)Productivity surprise: Many students don't expect mangroves to top productivity rankings — remember the ~2,500 figure
Climate limits: Mangroves need tropical warmth — they don't grow in temperate coastal areas
Salinity adaptation: Not all coastal plants can survive salt water — mangroves have special salt excretion mechanisms
Ocean Productivity Paradox
Environment oceans
Ocean Productivity Paradox: Why Vast Oceans Have Low NPP
Open oceans have lowest NPP at only ~125 g/m²/year
Most ocean surface water is nutrient-poor — a 'biological desert'
Only coastal zones and upwelling areas are highly productive
The ocean productivity paradox confuses many students: oceans cover 70% of Earth and produce much of our oxygen, yet have the lowest productivity per unit area. This happens because vast open ocean areas lack the nutrients needed for high primary production.
Ocean Zone Productivity
Ocean Zone | NPP Level | Why? | Examples |
|---|---|---|---|
Open Ocean | Very Low (~125) | Nutrient-poor surface waters | Mid-Atlantic, Central Pacific |
Coastal Waters | High (~500-1000) | River nutrients + shallow depth | Continental shelves |
Upwelling Zones | Very High (~1000+) | Deep nutrient-rich water rises | Peru coast, California coast |
Coral Reefs | Very High (~2000) | Nutrient recycling in shallow water | Great Barrier Reef |
Why Open Oceans Are Unproductive
Nutrient stratification: Essential nutrients (nitrogen, phosphorus) sink to deep waters
Thermocline barrier: Warm surface layer doesn't mix with cold, nutrient-rich deep water
Light limitation: Phytoplankton near surface can't access deep nutrients
Vast distances: Far from land-based nutrient sources like rivers
Low iron availability: Iron limits growth even when other nutrients are present
Size vs productivity: Students assume bigger = more productive — but oceans are nutrient deserts per m²
Total vs per-area: Oceans produce lots of total oxygen but have low productivity per unit area
Coastal confusion: Don't mix coastal productive zones with vast open ocean areas