Consider the following statements: I. Carbon dioxide (CO₂) emissions in India are less than 0.5 t CO₂/capita. II. In terms of CO₂ emissions from fuel combustion, India ranks second in Asia-Pacific region. III. Electricity and heat producers are the largest source of CO₂ emissions in India. Which of the statements given above is/are correct?
Contents16
- AI and III only
- BII only
- CII and III only
- DI, II and III
Show answer
Answer: (C) II and III only
Let's check each statement about India's carbon emissions:
(I) 'CO₂ emissions in India are less than 0.5 t CO₂/capita' — INCORRECT.
India's per capita CO₂ emissions are approximately 1.9-2.0 tonnes per year (as of recent data).
While this is much lower than countries like the US (~15 t/capita) or China (~8 t/capita), it is still far above 0.5 tonnes.
The statement significantly understates India's per capita emissions. ✗
(II) 'India ranks second in Asia-Pacific in CO₂ emissions from fuel combustion' — CORRECT.
China is the largest emitter in the Asia-Pacific region (and globally), and India is the second largest.
India surpassed Japan to take this position.
Overall globally, India is the third-largest CO₂ emitter after China and the US. ✓
(III) 'Electricity and heat producers are the largest source of CO₂ emissions in India' — CORRECT.
India's power sector (electricity generation and heat production) is the single largest source of CO₂ emissions, primarily because India still relies heavily on coal-fired thermal power plants for about 70% of its electricity generation. ✓
Statements II and III are correct. Answer is (c).
India is the world's third-largest CO₂ emitter after China and the US, but its per capita emissions are around 2 tonnes, much lower than developed countries.
Coal-fired thermal power plants generate about 70% of India's electricity, making the power sector the largest source of CO₂ emissions in the country.
The question tests whether students can distinguish between total emissions rankings versus per capita emissions data for India.
India's CO₂ Emissions Profile
Environment CO₂ emissions India per capita fuel combustion
India's CO₂ Emissions: Per Capita, Global Ranking & Sectoral Breakdown
India's per capita CO₂ emissions are approximately 1.9-2.0 tonnes/year, not below 0.5 tonnes
India ranks 3rd globally and 2nd in Asia-Pacific for total CO₂ emissions from fuel combustion
Electricity and heat production is India's largest CO₂ emission source due to coal dependence
India's emissions are still much lower per capita than developed countries like US (15 t) or China (8 t)
Context
India's CO₂ emission profile reflects its status as a developing economy with large population but relatively lower energy consumption per person. Understanding both total emissions and per capita figures is crucial for climate policy discussions.
India's Global CO₂ Position
Metric | India's Rank | Value | Context |
|---|---|---|---|
Total CO₂ Emissions | 3rd globally | ~2.9 billion tonnes | After China and USA |
Asia-Pacific Rank | 2nd | - | After China, ahead of Japan |
Per Capita Emissions | Much lower | 1.9-2.0 t/capita | vs USA: 15 t, China: 8 t |
Growth Trend | Increasing | ~5% annually | Due to economic development |
Sectoral CO₂ Sources in India
Sector | Share | Primary Source | Key Factor |
|---|---|---|---|
Electricity & Heat | Largest | Coal-fired power plants | ~70% electricity from coal |
Transport | Second largest | Road transport, aviation | Growing vehicle ownership |
Industry | Significant | Steel, cement, chemicals | Manufacturing growth |
Buildings | Smaller | Commercial & residential | Energy efficiency improving |
Question Analysis
This question tested knowledge of India's emission statistics. Statement I was a trap with an unrealistically low per capita figure (0.5 t vs actual 1.9-2.0 t). Statements II and III correctly identified India's regional ranking and dominant emission source.
Trap: Statement I gives 0.5 t CO₂/capita - actual figure is 1.9-2.0 tonnes, nearly 4 times higher
Don't confuse India's low per capita emissions with high total emissions due to large population
India is 3rd globally but 2nd in Asia-Pacific - regional vs global rankings differ
Electricity sector dominates because 70% power from coal, not because of total energy use
Global CO₂ Emissions Ranking
Environment Asia-Pacific second ranking
Global & Regional CO₂ Emissions Rankings: Major Emitters Comparison
China is the world's largest CO₂ emitter, followed by USA and India
In Asia-Pacific region: China 1st, India 2nd, Japan 3rd
India overtook Japan to become Asia-Pacific's second-largest emitter
Top Global CO₂ Emitters
Global Rank | Country | Total Emissions | Per Capita | Key Driver |
|---|---|---|---|---|
1st | China | ~11 billion tonnes | ~8 t/capita | Manufacturing, coal power |
2nd | USA | ~5 billion tonnes | ~15 t/capita | High consumption, transport |
3rd | India | ~2.9 billion tonnes | ~2 t/capita | Coal power, development |
4th | Russia | ~1.8 billion tonnes | ~12 t/capita | Oil, gas, heavy industry |
5th | Japan | ~1.1 billion tonnes | ~9 t/capita | Industry, limited renewables |
Asia-Pacific Regional Ranking
Regional Rank | Country | Trend | Climate Commitment |
|---|---|---|---|
1st | China | Peak before 2030 | Carbon neutrality by 2060 |
2nd | India | Growing with development | Net zero by 2070 |
3rd | Japan | Declining slowly | Carbon neutrality by 2050 |
4th | South Korea | Stabilizing | Carbon neutrality by 2050 |
5th | Australia | Declining | Net zero by 2050 |
Don't confuse total emissions (India 3rd globally) with per capita (India much lower)
Regional vs global rankings differ - India is 2nd in Asia-Pacific but 3rd globally
Japan is now 3rd in Asia-Pacific, having been overtaken by India
India's Power Sector Emissions
Environment electricity heat producers largest source
India's Power Sector: Largest CO₂ Source Due to Coal Dependence
Electricity and heat production accounts for the largest share of India's CO₂ emissions
~70% of India's electricity comes from coal-fired thermal power plants
India is gradually increasing renewable energy capacity but coal remains dominant
Why Power Sector Dominates
India's electricity generation relies heavily on coal-fired thermal plants because coal is domestically abundant and historically cheaper. This makes the power sector the single largest source of CO₂ emissions, even as India rapidly expands renewable capacity.
India's Electricity Generation Mix
Source | Share | CO₂ Intensity | Trend |
|---|---|---|---|
Coal | ~70% | Very high | Slowly declining share |
Natural Gas | ~2% | Medium | Limited growth |
Nuclear | ~3% | Very low | Gradual expansion |
Hydro | ~12% | Very low | Seasonal variation |
Solar & Wind | ~13% | Zero | Fastest growing |
Power Sector Emission Drivers
# Power Sector CO₂ Emissions
## Coal Dependence
- Domestic availability
- Low cost
- Existing infrastructure
- Technical expertise
## Growing Demand
- Industrial growth
- Urbanization
- Rural electrification
- Air conditioning
## Transition Challenges
- Grid integration
- Storage costs
- Stranded assets
- Just transitionPower sector is largest CO₂ source, not transport (unlike in some developed countries)
Coal's 70% share in electricity makes this sector emission-intensive despite renewable growth
Don't confuse electricity generation with total energy consumption - transport uses oil, not coal
Per Capita Emissions Comparison
Environment per capita 0.5 t CO₂/capita
Per Capita CO₂ Emissions: India vs Developed Countries
India's per capita emissions are 1.9-2.0 tonnes CO₂/year, not 0.5 tonnes as stated
This is still much lower than USA (15 t) and China (8 t) per capita
Per capita emissions reflect consumption patterns and development level
Context
Per capita emissions measure the average CO₂ footprint per person, reflecting lifestyle, consumption, and energy access. India's relatively low per capita emissions highlight the equity dimension in climate discussions - high population but lower individual consumption.
Per Capita CO₂ Emissions Comparison
Country | Per Capita Emissions | Development Level | Key Drivers |
|---|---|---|---|
USA | ~15 t/capita | Developed | High consumption, large homes, transport |
China | ~8 t/capita | Upper middle income | Manufacturing, urbanization |
Germany | ~8 t/capita | Developed | Industry, heating, declining trend |
India | ~2 t/capita | Lower middle income | Basic energy needs, growing |
Bangladesh | ~0.5 t/capita | Low income | Limited energy access |
Global Per Capita Visualization
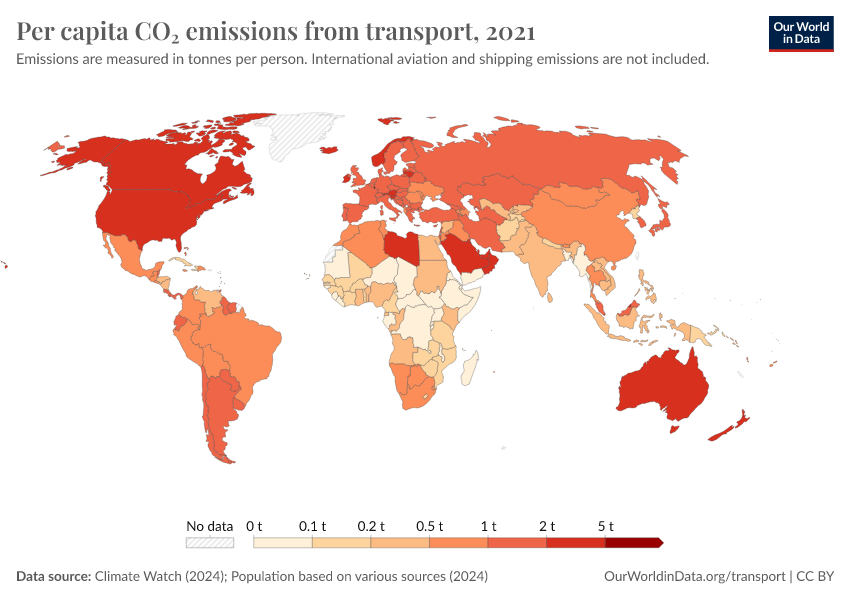
Source: Our World in Data — Per capita CO₂ emissions from transport, 2023 · ourworldindata.org
0.5 t/capita would place India at Bangladesh level - actual figure is 1.9-2.0 tonnes
Don't confuse India's high total emissions with low per capita - large population creates this gap
Per capita matters for climate equity - India argues developed countries should cut first