In a given year in India, official poverty lines are higher in some States than in others because
Contents17
- Apoverty rates vary from State to State
- Bprice levels vary from State to State
- CGross State Product varies from State to State
- Dquality of public distribution varies from State to State
Show answer
Answer: (B) price levels vary from State to State
The correct answer is (B) — Price levels vary from State to State.
The official poverty line represents the minimum income needed to meet basic needs.
Since the cost of living (prices of food, essentials) differs from state to state, the poverty line is set higher in expensive states and lower in cheaper ones.
It is not about how many poor people there are (A), or the state's total economic output (C), or PDS quality (D).
Tip:
- Poverty line = income needed for basics.
- Higher prices in a state = higher poverty line for that state.
The poverty line is the minimum income needed to afford basic necessities, so it must be adjusted higher in states where goods cost more.
This tests whether students understand that poverty measurement accounts for regional price differences, not just counting poor people or state wealth levels.
Poverty Line Methodology in India
Indian Economy official poverty lines poverty lines
Poverty Line Methodology: State Variations & UPSC Concepts
Poverty line = minimum income needed to meet basic needs like food, clothing, shelter
Official poverty lines are higher in expensive states, lower in cheaper states
Price levels (cost of living) determine poverty line variations across states
Poverty line is NOT based on poverty rates, GSP, or PDS quality
Core Logic
The poverty line represents the minimum income a person needs to afford basic necessities. Since a meal in Mumbai costs more than in rural Bihar, the poverty line must be adjusted for local price levels. This ensures fair measurement across India's diverse economic landscape.
Poverty Line Determinants
Factor | Role in Poverty Line Setting | Example |
|---|---|---|
Price Levels (Cost of Living) | PRIMARY determinant - higher prices = higher poverty line | Mumbai has higher food/rent costs → higher poverty line |
Poverty Rates | NO ROLE - outcome, not input | High poverty in Bihar doesn't lower its poverty line |
Gross State Product | NO ROLE - state wealth doesn't set poverty threshold | Rich Gujarat still sets poverty line based on local prices |
PDS Quality | NO ROLE - delivery mechanism, not poverty measure | Good PDS doesn't change what income defines poverty |
India's Poverty Measurement Evolution
Tendulkar Committee (2009): Shifted focus from calorie-based to expenditure-based poverty lines, accounting for non-food essentials
Rangarajan Committee (2014): Recommended higher poverty lines, including health and education costs
NITI Aayog: Currently developing Multidimensional Poverty Index beyond just income measures
State-specific baskets: Each state has different consumption patterns reflected in poverty line calculations
Question Connection
This PYQ tests whether students understand poverty lines as cost-adjusted income thresholds rather than poverty outcomes. The trap options (A, C, D) confuse poverty line methodology with poverty results or government performance.
Trap: Thinking poverty rates determine poverty lines — actually poverty rates are measured using poverty lines
Trap: Assuming rich states automatically have higher poverty lines — only price levels matter, not state wealth
Trap: Confusing PDS quality with poverty measurement — PDS is a solution, poverty line is a measurement tool
Reversal Trap: Higher GSP = higher poverty line — wrong direction, poverty line depends on costs not income
Price Level Variations Across Indian States
Indian Economy price levels vary State to State
Price Level Variations: Why Costs Differ Across Indian States
Price levels = average cost of goods and services in a region
Urban metros have highest price levels, rural areas lowest
Transport costs, land prices, wages drive interstate price differences
Price variations justify state-specific poverty lines and HRA differences
Factors Causing Price Variations
# Price Level Differences
## Geographic Factors
- Transport costs to remote areas
- Land availability
- Climate affecting agriculture
## Economic Development
- Urban vs rural wages
- Industrial concentration
- Service sector presence
## Government Policy
- State taxes (VAT, excise)
- Subsidies
- Market regulations
## Market Structure
- Competition levels
- Supply chain efficiency
- Local monopolies
Price Level Examples
Category | High Price States/Cities | Low Price States/Areas | Key Driver |
|---|---|---|---|
Housing | Mumbai, Delhi, Bangalore | Rural Bihar, Odisha, UP | Land scarcity vs availability |
Food | Metro cities | Agricultural surplus states | Transport & retail costs |
Fuel | Remote northeastern states | Refinery states (Gujarat) | Transportation distance |
Services | IT hubs (Hyderabad, Pune) | Tier-3 cities | Wage levels & demand |
Policy Applications
HRA (House Rent Allowance): Government employees get different HRA rates — highest in A1 cities, lowest in rural areas
Dearness Allowance: Central employees receive uniform DA, but state employees may get region-specific rates
Minimum Wages: States set different minimum wages partly reflecting local price levels
MGNREGA wages: Vary by state, considering local cost of living and agricultural wage patterns
Trap: Assuming all metros have identical price levels — Mumbai > Delhi > Bangalore in housing costs
Confusion: Price levels vs inflation — price levels are absolute costs, inflation is rate of change
Reversal: Rich states always have high prices — Kerala has moderate prices despite good development
Poverty Indicators & Measurement Methods
Indian Economy poverty rates
Poverty Indicators: How India Measures & Reports Poverty
Poverty rate = percentage of population below poverty line (headcount ratio)
NSSO surveys provide poverty data every 5 years through consumption expenditure
Multidimensional Poverty Index includes health, education, living standards beyond income
Types of Poverty Measures
Indicator | What It Measures | Data Source | Frequency |
|---|---|---|---|
Headcount Ratio | % of people below poverty line | NSSO Consumption Surveys | Every 5 years |
Poverty Gap | Average income shortfall of poor | NSSO analysis | With consumption surveys |
Multidimensional Poverty Index | Health, education, living standards | NITI Aayog | Annual updates |
Global MPI | International comparison metric | UNDP/Oxford | Annual global report |
Recent Poverty Trends
Rural poverty traditionally higher than urban poverty, but gap is narrowing
COVID-19 impact: Likely reversed poverty reduction gains, especially in urban areas
State variations: Bihar, Jharkhand, Assam have highest poverty rates; Kerala, Punjab lowest
Tribal populations show highest poverty incidence across all states
India's Poverty Map
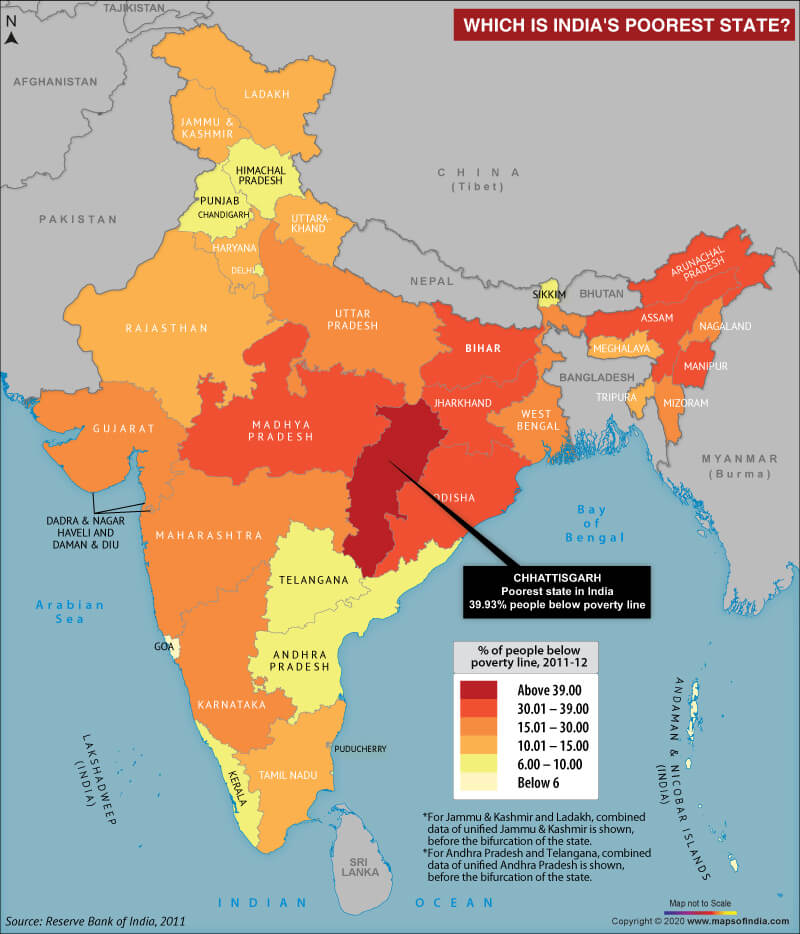
Source: India Map — Which is India's Poorest State? - Answers · www.mapsofindia.com
Critical Distinction: Poverty rates are outcomes measured using poverty lines — don't confuse cause and effect
Data Confusion: NSSO surveys measure consumption, not income — poverty based on spending patterns
Frequency Trap: Poverty data comes every 5 years from NSSO, not annually like GDP
Gross State Product & Economic Indicators
Indian Economy Gross State Product
Gross State Product: Understanding State-Level Economic Measurement
GSDP = total value of goods and services produced within a state's boundaries
Per capita GSDP better indicates individual prosperity than total GSDP
Maharashtra, Tamil Nadu, Gujarat have highest GSDP; Sikkim, Mizoram lowest
GSDP vs GDP Comparison
Aspect | GSDP (State Level) | GDP (National Level) |
|---|---|---|
Definition | Value of production within state boundaries | Value of production within country boundaries |
Calculation | Primary + Secondary + Tertiary sectors of state | Sum of all state GSDPs + adjustments |
Usage | State planning, resource allocation | National policy, international comparison |
Top Contributors | Maharashtra (15%), Tamil Nadu (9%) | Agriculture (17%), Industry (30%), Services (53%) |
GSDP and Development Relationship
High GSDP ≠ Low Poverty: Maharashtra has highest GSDP but significant absolute poor population
Per capita GSDP matters more: Goa, Sikkim have high per capita income despite small total GSDP
Sectoral composition: Service-dominated states (Karnataka, Telangana) show rapid GSDP growth
Industrial states: Gujarat, Tamil Nadu maintain steady GSDP through manufacturing base
Why GSP Doesn't Determine Poverty Lines
A state's total economic output (GSDP) doesn't determine what income level constitutes poverty within that state. Rich states can have expensive living costs requiring higher poverty lines, while economically smaller states might have lower costs. The poverty line reflects individual survival needs, not state wealth.
Trap: Thinking rich states automatically have higher poverty lines — price levels matter, not state GDP
Size vs Prosperity: Large GSDP may just mean big population, not high per capita income
Absolute vs Relative: GSDP measures total production, poverty line measures individual minimum needs