For the measurement/ estimation of which of the following are satellite images/remote sensing data used? 1. Chlorophyll content in the vegetation of a specific location 2. Greenhouse gas emissions from rice paddies of a specific location 3. Land surface temperatures of a specific location Select the correct answer using the code given below.
Contents20
- A1 only
- B2 and 3 only
- C3 only
- D1, 2 and 3
Show answer
Answer: (D) 1, 2 and 3
The correct answer is (D) — 1, 2 and 3.
Satellites and remote sensing can measure all three.
Chlorophyll content in vegetation (statement 1) is measured using NDVI (Normalized Difference Vegetation Index), which detects how green and healthy plants are based on how they reflect light.
Greenhouse gas emissions from rice paddies (statement 2) can be estimated by satellites measuring methane and CO2 concentrations in the atmosphere.
Land surface temperatures (statement 3) are routinely measured by thermal sensors on satellites.
Tip: Satellites can 'see' plant health (NDVI), gas emissions (spectral analysis), and surface temperature (thermal sensors).
Remote sensing satellites can measure chlorophyll levels, greenhouse gas emissions, and surface temperatures using different types of sensors and spectral analysis techniques.
ISRO's climate monitoring satellites became more prominent around 2018-2019 for tracking agricultural health and emissions, making remote sensing applications a current topic.
The question tests whether students know the full range of remote sensing capabilities beyond just basic imaging.
Satellite Remote Sensing Principles
Science And Technology satellite images remote sensing data measurement estimation
Satellite Remote Sensing: How Satellites 'See' Earth
Satellites use electromagnetic radiation to measure Earth's features without physical contact
Passive sensors detect natural radiation (sunlight reflection, thermal emission)
Different wavelengths reveal different information about Earth's surface
Active sensors send signals and measure the return (radar, LiDAR)
Remote sensing works because different objects absorb and reflect electromagnetic radiation differently. When satellites detect these patterns across various wavelengths, they can identify and measure specific features on Earth's surface.
Key Wavelength Bands & Applications
Wavelength Band | What It Detects | Main Applications | Example |
|---|---|---|---|
Visible (0.4-0.7 μm) | Reflected sunlight | Vegetation health, water quality | NDVI for crop monitoring |
Near-Infrared (0.7-1.3 μm) | Plant cell structure | Biomass, vegetation types | Forest cover mapping |
Thermal Infrared (8-14 μm) | Heat emission | Surface temperature | Urban heat islands |
Microwave (1mm-1m) | Surface roughness, moisture | Soil moisture, ice sheets | Weather radar |
Remote Sensing Process
%%{init: {"flowchart": {"wrappingWidth": 460}}}%%
flowchart TD
  s1["`**Energy Source**
Sun provides electromagnetic radiation`"]
  s2["`**Interaction**
Radiation hits Earth's surface - absorbed, reflected, or transmitted`"]
  s3["`**Detection**
Satellite sensors capture reflected/emitted radiation`"]
  s4["`**Processing**
Convert signals to digital data and images`"]
  s5["`**Analysis**
Extract information about surface features`"]
  s1 --> s2
  s2 --> s3
  s3 --> s4
  s4 --> s5
NDVI & Vegetation Monitoring
Science And Technology Chlorophyll content vegetation
NDVI: Measuring Plant Health from Space
NDVI = (NIR - Red) / (NIR + Red) — measures vegetation greenness
Healthy plants reflect high NIR and absorb red light for photosynthesis
NDVI values range from -1 to +1 (higher = greener vegetation)
Used for crop yield prediction, drought monitoring, and forest health
NDVI (Normalized Difference Vegetation Index) works because chlorophyll in healthy plants strongly absorbs red light for photosynthesis but reflects near-infrared light. The greater this difference, the healthier and denser the vegetation.
NDVI Value Interpretation
NDVI Range | Surface Type | Vegetation Condition | Example |
|---|---|---|---|
-1 to 0 | Water, clouds, snow | No vegetation | Lakes, ice sheets |
0 to 0.2 | Bare soil, rock | Sparse/no vegetation | Deserts, urban areas |
0.2 to 0.5 | Shrubs, grassland | Moderate vegetation | Pastures, crops |
0.5 to 1.0 | Dense forests | Healthy, dense vegetation | Tropical rainforests |
NDVI Applications in India
Kharif and Rabi crop monitoring — ISRO uses NDVI for crop yield forecasting
Drought early warning — declining NDVI indicates crop stress before visible damage
Forest cover assessment — annual forest surveys use NDVI to track deforestation
Precision agriculture — farmers use NDVI maps to optimize fertilizer application
NDVI Visualization
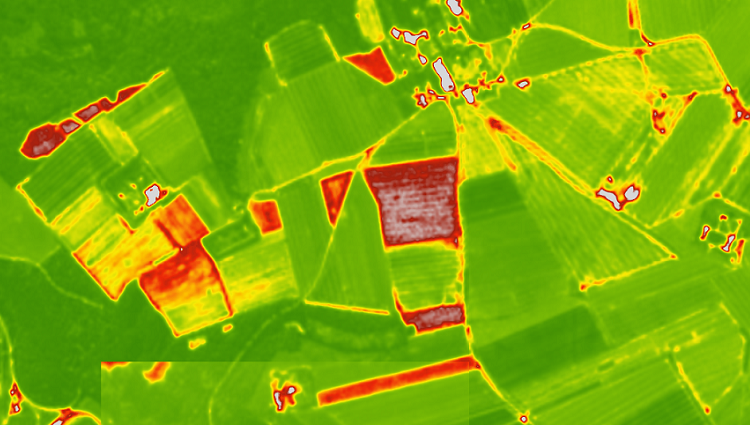
Source: OpenWeather — Visualisation of the NDVI index on satellite maps. Custom palettes ... · openweather.co.uk
Trap: NDVI measures vegetation health, not just presence — dead plants have low NDVI
Trap: Clouds and water give negative NDVI values, not zero
Confusion: NDVI uses near-infrared, not thermal infrared for temperature
Greenhouse Gas Monitoring
Science And Technology Greenhouse gas emissions rice paddies
Satellite Detection of Greenhouse Gas Emissions
Satellites detect CO₂ and CH₄ by measuring specific absorption wavelengths
Rice paddies are major methane sources due to anaerobic decomposition
OCO-2 and GOSAT satellites specialize in greenhouse gas monitoring
India contributes ~3% of global CO₂ but ~17% of global methane emissions
Satellites detect greenhouse gases using spectral analysis — each gas absorbs specific wavelengths of infrared light. By measuring how much light is absorbed at these wavelengths, satellites can calculate gas concentrations in the atmosphere.
Major Greenhouse Gas Sources
Gas | Major Sources | Satellite Detection Method | Key Wavelength |
|---|---|---|---|
CO₂ | Fossil fuels, deforestation | Near-infrared absorption | 1.6 & 2.0 μm |
CH₄ (Methane) | Rice paddies, livestock, wetlands | Shortwave infrared absorption | 1.65 μm |
N₂O | Agriculture, fossil fuels | Mid-infrared absorption | 4.5 μm |
H₂O | Evaporation, transpiration | Multiple infrared bands | Various |
Rice Paddies & Methane Emissions
Flooded rice fields create anaerobic conditions where bacteria produce methane
Peak emissions occur during flooding and organic matter decomposition phases
Seasonal monitoring tracks emissions from transplanting to harvesting cycles
Mitigation techniques include alternate wetting-drying and organic amendment timing
Satellite GHG Monitoring Applications
# GHG Monitoring
## Policy Support
- Carbon trading verification
- Emission reduction tracking
- International agreements
## Agricultural Applications
- Rice paddy emissions
- Livestock methane
- Soil carbon changes
## Industrial Monitoring
- Power plant emissions
- Oil & gas leaks
- Urban pollution
## Natural Sources
- Wetland methane
- Forest fires
- Volcanic CO₂Trap: Satellites measure atmospheric concentrations, not direct surface emissions
Trap: Rice paddies are significant methane sources, not just CO₂ sources
Confusion: Gas detection requires infrared sensors, not visible light cameras
Thermal Remote Sensing
Science And Technology Land surface temperatures
Land Surface Temperature Measurement from Space
Thermal infrared sensors detect heat emitted by Earth's surface
LST differs from air temperature — measures actual surface heat
Used for urban heat islands, drought monitoring, and climate studies
MODIS, Landsat TIR, and ASTER provide thermal imagery
Land Surface Temperature (LST) measurement works because all objects above absolute zero emit thermal radiation. Satellites detect this emitted heat in the thermal infrared band (8-14 μm) and convert it to temperature values.
Thermal vs Other Temperature Measurements
Parameter | What It Measures | Measurement Method | Typical Values |
|---|---|---|---|
Land Surface Temperature | Surface skin temperature | Thermal infrared from satellites | Can exceed 70°C on hot surfaces |
Air Temperature | Atmospheric temperature | Weather stations at 2m height | Usually 20-45°C in tropics |
Soil Temperature | Subsurface temperature | Ground sensors at various depths | More stable than surface |
Sea Surface Temperature | Ocean skin temperature | Thermal IR + microwave | 26-30°C in tropical oceans |
LST Applications & Significance
Urban heat island mapping — cities are 2-5°C warmer than surroundings
Agricultural drought monitoring — high LST indicates water stress in crops
Climate change studies — long-term LST trends show global warming patterns
Energy balance studies — LST helps calculate heat fluxes between land and atmosphere
LST Measurement Process
%%{init: {"flowchart": {"wrappingWidth": 460}}}%%
flowchart TD
  s1["`**Thermal Emission**
Earth's surface emits infrared radiation based on temperature`"]
  s2["`**Atmospheric Correction**
Account for atmospheric absorption and scattering`"]
  s3["`**Sensor Detection**
Satellite thermal sensor records radiation intensity`"]
  s4["`**Temperature Conversion**
Apply Planck's law and emissivity corrections`"]
  s5["`**LST Product**
Generate calibrated land surface temperature map`"]
  s1 --> s2
  s2 --> s3
  s3 --> s4
  s4 --> s5
Urban Heat Island Example
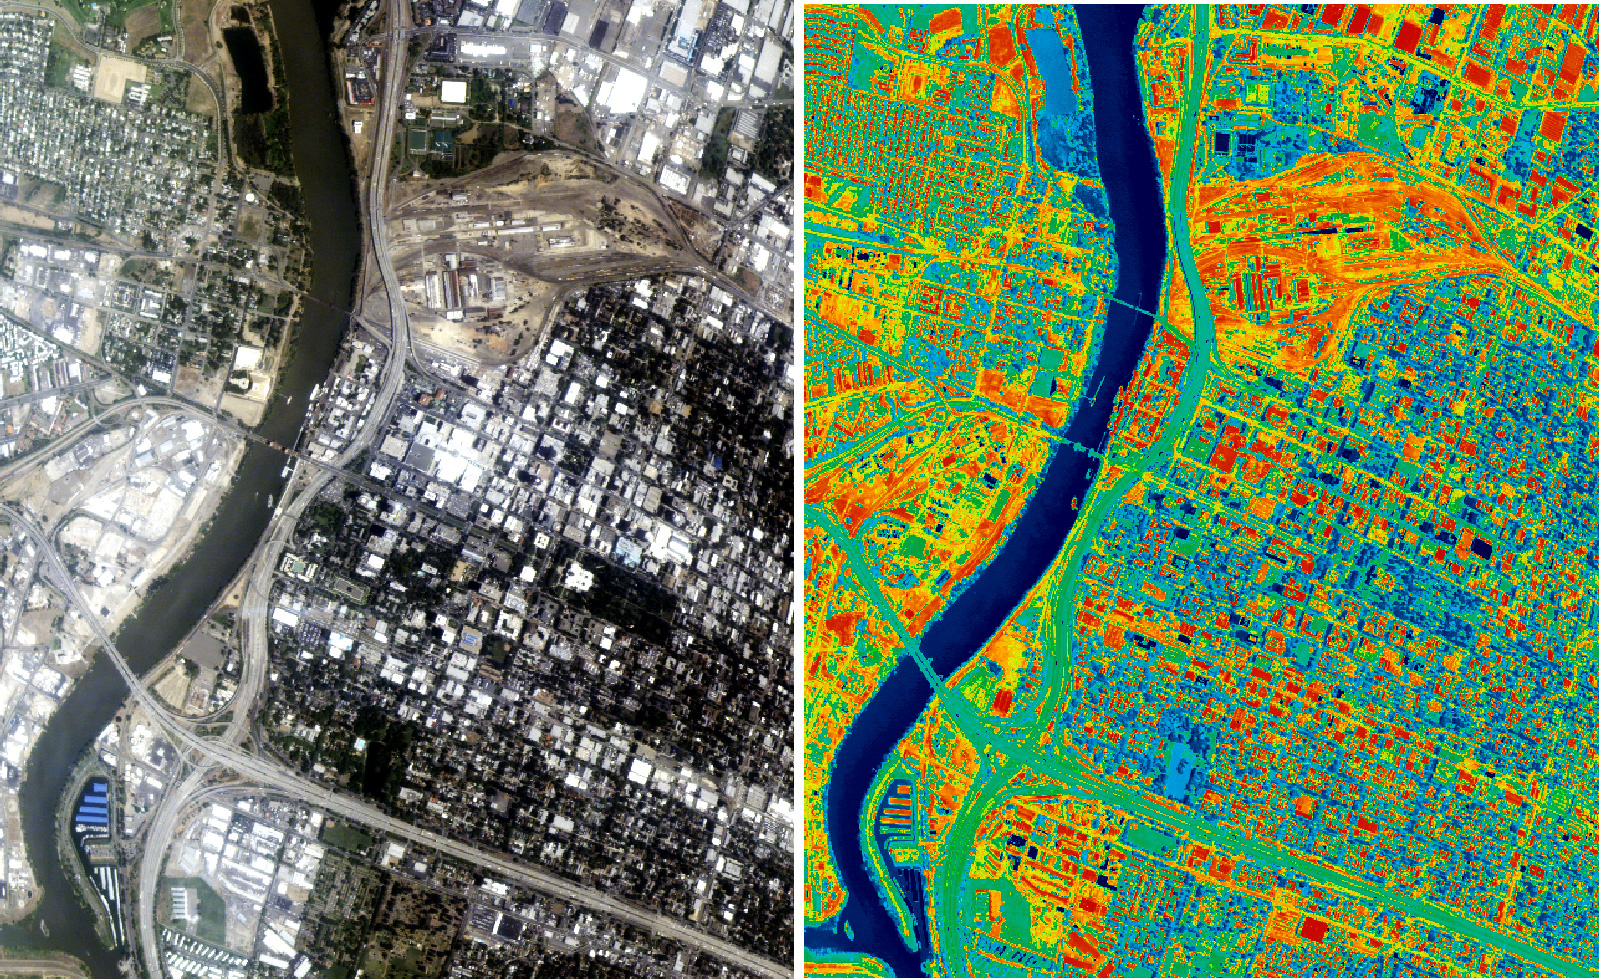
Source: Geospatial World — Towards a sustainable future – a new take on urban heat mapping · geospatialworld.net
Trap: LST is surface temperature, not air temperature measured by weather stations
Trap: Thermal sensors work day and night, unlike visible light sensors
Confusion: Cloud cover blocks thermal sensors — they cannot see through clouds
Indian Satellite Programs
Science And Technology
India's Earth Observation Satellite Fleet
IRS (Indian Remote Sensing) series — India's main Earth observation program
Cartosat series provides high-resolution imaging for mapping and surveying
RISAT uses radar for all-weather imaging including through clouds
India has 50+ operational Earth observation satellites as of 2023
India's satellite-based remote sensing program began in 1988 with IRS-1A. Today, ISRO operates one of the world's largest constellations of Earth observation satellites for agriculture, disaster management, and resource monitoring.
Major Indian Earth Observation Satellites
Satellite Series | Launch Period | Key Capabilities | Main Applications |
|---|---|---|---|
IRS-1/2 Series | 1988-1997 | Multi-spectral imaging | Land use, vegetation mapping |
Cartosat Series | 2005-2019 | High-resolution stereo imaging | Topographic mapping, urban planning |
RISAT Series | 2012-2020 | Synthetic Aperture Radar | All-weather imaging, disaster monitoring |
Resourcesat Series | 2003-2016 | Advanced multi-spectral | Agriculture, forest, water resources |
Oceansat Series | 1999-2016 | Ocean color, scatterometer | Sea surface temperature, ocean winds |
ISRO Remote Sensing Applications
# ISRO Earth Observation
## Agriculture
- Crop area estimation
- Yield forecasting
- Drought assessment
- Precision farming
## Disaster Management
- Flood mapping
- Cyclone tracking
- Landslide monitoring
- Forest fire detection
## Natural Resources
- Mineral exploration
- Groundwater mapping
- Forest cover monitoring
- Coastal zone studies
## Urban Planning
- City expansion mapping
- Infrastructure planning
- Traffic management
- Pollution monitoring
Current Flagship Missions
Cartosat-3 — India's highest resolution Earth imaging satellite at 0.25m resolution
RISAT-2B — All-weather radar imaging for border surveillance and agriculture
Resourcesat-3 — Successor to IRS series for comprehensive land and water resource studies
EOS-01 — Latest in Earth Observation Satellite series with advanced multispectral capability
Trap: RISAT uses radar, not optical sensors — works through clouds and at night
Trap: Cartosat is for high-resolution mapping, not weather or climate monitoring
Date confusion: First IRS satellite was IRS-1A in 1988, not IRS-1 in 1990s