As per the NSSO 70th Round "Situation Assessment Survey of Agricultural Households", consider the following statements: 1. Rajasthan has the highest percentage share of agricultural households among its rural households. 2. Out of the total agricultural households in the country, a little over 60 percent belong to OBCs. 3. In Kerala, a little over 60 percent of agricultural households reported to have received maximum income from source other than agricultural activities. Which of the statements given above is/are correct?
Contents21
- A2 and 3 only
- B2 only
- C1 and 3 only
- D1, 2 and 3
Show answer
Answer: (C) 1 and 3 only
Correct Answer: (c) 1 and 3 only
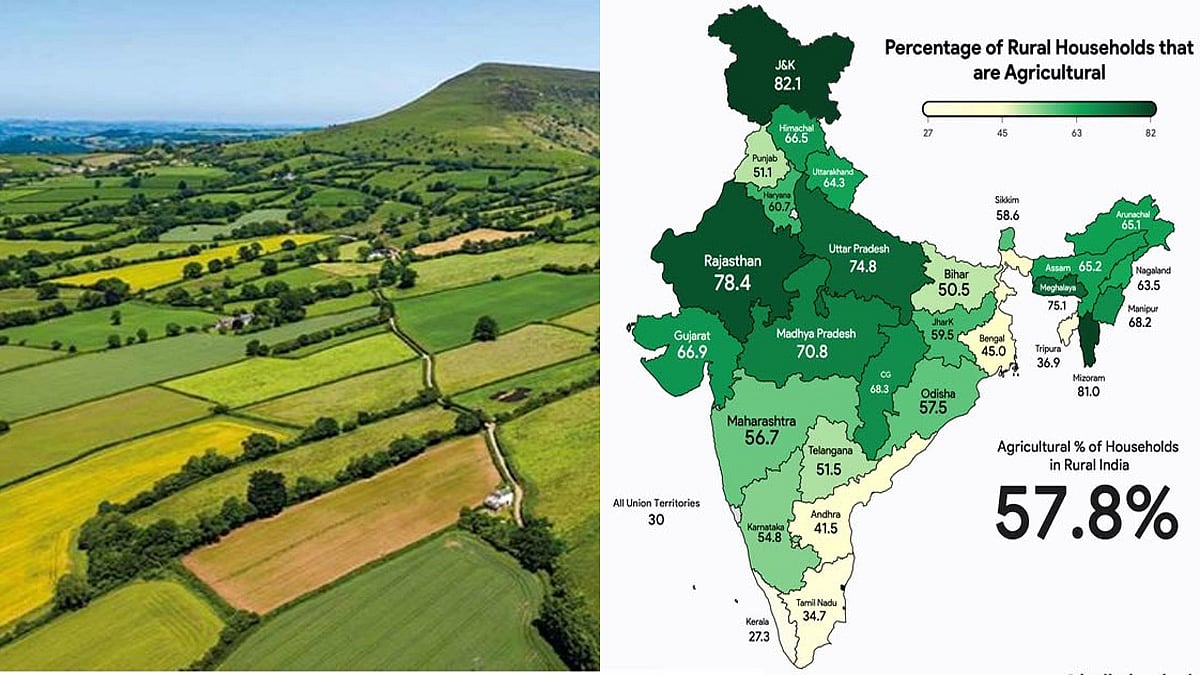
Statement 1 is CORRECT: Rajasthan had the highest percentage of farming households — 78.4% of all rural households were agricultural. This was followed by Uttar Pradesh (74.8%) and Madhya Pradesh (70.8%). Kerala had the lowest at just 27.3%.
Statement 2 is WRONG: The question says 'a little over 60%' of agricultural households belong to OBCs — this is an exaggeration. The actual figure was about 45% (not 60%). Around 16% were from Scheduled Castes (SC) and 13% from Scheduled Tribes (ST).
Statement 3 is CORRECT: Kerala is unique — about 61% of its agricultural households actually earned more from non-farming activities than from farming. This makes sense because Kerala's economy relies heavily on remittances (money sent by workers abroad), tourism, and services rather than agriculture.
REMEMBER:
- Rajasthan = most agricultural state (78.4%).
- Kerala = least agricultural (27.3%) and 61% earn more from non-farm work.
- OBCs = ~45% of agricultural households, NOT 60%.
The NSSO 70th Round Survey (2013) was a major comprehensive assessment of agricultural households that provided detailed state-wise and caste-wise data on farming patterns and income sources.
Kerala's unique economic structure means most of its agricultural households earn more from remittances, services, and tourism than from actual farming, while Rajasthan remains heavily agriculture-dependent.
UPSC is testing whether students can distinguish between agricultural dependency (percentage of rural households doing farming) versus agricultural income dependency (what percentage of income comes from farming).
NSSO 70th Round Agricultural Survey
Indian Economy NSSO 70th Round Situation Assessment Survey Agricultural Households
NSSO 70th Round: Situation Assessment Survey of Agricultural Households (2013)
NSSO 70th Round (2013) assessed situation of agricultural households across India
Rajasthan had highest share of agricultural households at 78.4% of rural households
Kerala had lowest agricultural household share at 27.3% with 61% earning more from non-farm sources
OBCs comprised about 45% of agricultural households, not 60%
Survey Context
The National Sample Survey Organisation (NSSO) conducted its 70th Round survey in 2013 to assess the economic condition of agricultural households. This was a comprehensive study covering income sources, cropping patterns, and socio-economic status of farming families across all states.
State-wise Agricultural Households
State | % of Rural Households | Key Feature |
|---|---|---|
Rajasthan | 78.4% | Highest agricultural dependency |
Uttar Pradesh | 74.8% | Second highest |
Madhya Pradesh | 70.8% | Third highest |
Kerala | 27.3% | Lowest agricultural dependency |
Social Composition of Agricultural Households
Category | Share (%) | Note |
|---|---|---|
OBC | ~45% | Largest group, but not 60% |
General | ~26% | Second largest |
Scheduled Castes | ~16% | Third largest |
Scheduled Tribes | ~13% | Smallest group |
Kerala's Unique Pattern
61% of Kerala's agricultural households earned maximum income from non-agricultural sources
Primary non-farm income sources: remittances from Gulf countries, tourism, and services
Reflects Kerala's service-oriented economy rather than agriculture-dependent model
Lowest agricultural household percentage (27.3%) among all major states
Trap: Statement 2 inflates OBC share to 'little over 60%' — actual figure is around 45%
Common confusion: Rajasthan (desert state) has highest agricultural dependency, not lowest
Kerala paradox: Agricultural households earn more from non-farm activities than farming
Don't confuse NSSO rounds — 70th Round was conducted in 2013, not other years
State-wise Agricultural Dependency Patterns
Indian Economy Rajasthan Kerala agricultural households
Regional Variations in Agricultural Dependency Across Indian States
Northern and Central states show highest agricultural dependency (70%+ rural households)
Southern and Western states have lower agricultural dependency due to diversified economies
Rajasthan's 78.4% agricultural households despite arid climate reflects limited economic alternatives
Geographic Distribution
Agricultural dependency varies significantly across India's states, influenced by economic development, industrialization, and alternative livelihood opportunities. Counter-intuitively, some arid states like Rajasthan show the highest agricultural dependency due to limited non-farm employment options.
High vs Low Agricultural Dependency States
Category | Examples | Agricultural HH % | Reasons |
|---|---|---|---|
High Dependency | Rajasthan, UP, MP | 70-78% | Limited industrial base, rural economy |
Medium Dependency | Karnataka, Andhra Pradesh | 50-60% | Mixed agricultural-industrial economy |
Low Dependency | Kerala, Goa, Punjab | 25-40% | Services, remittances, industry |
Factors Affecting Agricultural Dependency
# Agricultural Dependency
## Economic Factors
- Industrial development
- Service sector growth
- Employment opportunities
## Geographic Factors
- Climate suitability
- Soil fertility
- Water availability
## Social Factors
- Education levels
- Skill development
- Migration patterns
## Policy Factors
- MGNREGA implementation
- Industrial promotion
- Rural development schemes
Key Insights from Survey
Desert states paradox: Rajasthan leads in agricultural households despite water scarcity
Coastal advantage: States like Kerala, Goa have diversified income through services and tourism
Migration impact: States with high out-migration show reduced agricultural dependency
Industrial correlation: States with strong manufacturing base show lower agricultural household percentages
Agricultural Dependency Map
Source: Metro Vaartha — Top 10 per cent rural households control 44 per cent of land in ... · english.metrovaartha.com
Non-farm Income in Rural Economy
Indian Economy maximum income source other than agricultural activities
Non-farm Income Sources in Rural India: The Kerala Model
Rural non-farm sector provides alternative income sources beyond agriculture
Kerala leads with 61% agricultural households earning more from non-farm sources
Gulf remittances are major non-farm income source for Kerala agricultural households
Rural Economic Diversification
The rural non-farm economy includes all economic activities in rural areas except agriculture, forestry, and fisheries. In states like Kerala, these sources often provide higher and more stable income than farming, leading to a unique economic structure where 'agricultural households' depend more on non-agricultural work.
Major Non-farm Income Sources
Income Source | Examples | States Where Prominent | Stability |
|---|---|---|---|
Remittances | Gulf countries, urban migration | Kerala, Punjab, UP | High |
Services | Tourism, transport, retail | Kerala, Goa, Himachal | Seasonal |
Manufacturing | Small industries, handicrafts | Tamil Nadu, Karnataka | Moderate |
Construction | MGNREGA, private projects | All states | Seasonal |
Trade & Commerce | Rural markets, agro-processing | Punjab, Haryana | Moderate |
Kerala's Non-farm Success Model
International migration: Large diaspora in Gulf countries sending regular remittances
High literacy rates: Enable service sector employment over manual farm work
Tourism industry: Provides year-round employment in hospitality and allied services
Small landholdings: Make intensive agriculture less viable, pushing families toward other sources
Government jobs: Higher proportion of rural families in public sector employment
Rural Livelihood Transition Process
%%{init: {"flowchart": {"wrappingWidth": 460}}}%%
flowchart TD
  s1["`**Traditional Agriculture**
Primary dependence on farming and allied activities`"]
  s2["`**Skill Development**
Education, migration, exposure to new opportunities`"]
  s3["`**Diversification**
Gradual shift to non-farm activities as supplementary income`"]
  s4["`**Income Dominance**
Non-farm sources exceed agricultural income`"]
  s5["`**Economic Security**
Reduced vulnerability to crop failures and weather risks`"]
  s1 --> s2
  s2 --> s3
  s3 --> s4
s4 --> s5Don't assume agricultural households means income only from farming — many earn more from other sources
Kerala's pattern is unique, not representative of other agricultural states
Non-farm income doesn't mean abandoning agriculture — families often continue both
Gulf remittances are external income, not domestic rural non-farm sector growth
Social Composition of Agricultural Households
Indian Economy OBCs 60 percent
Caste and Social Category Distribution in Indian Agriculture
OBCs form about 45% of agricultural households, making them the largest group
General category accounts for roughly 26% of agricultural households
SC and ST together comprise about 29% of agricultural households
Social Structure in Agriculture
The NSSO 70th Round survey revealed that agricultural households reflect India's overall social composition, with Other Backward Classes (OBCs) forming the largest segment. However, the exact percentage is around 45%, not the inflated figure of 'little over 60%' mentioned in exam traps.
Social Category Distribution (NSSO 70th Round)
Social Category | Share in Agri HH (%) | Share in Total Population (%) | Observation |
|---|---|---|---|
Other Backward Classes | ~45% | ~41% | Slightly higher representation |
General Category | ~26% | ~31% | Lower representation in farming |
Scheduled Castes | ~16% | ~16% | Proportional representation |
Scheduled Tribes | ~13% | ~8% | Higher agricultural dependency |
Key Patterns in Social Composition
OBCs dominate agriculture due to traditional occupation patterns and land ownership
General category under-representation suggests better access to non-agricultural employment
ST over-representation reflects limited livelihood alternatives in tribal areas
Regional variations exist - some states show different caste compositions in farming
Factors Behind Social Distribution
# Caste in Agriculture
## Historical Factors
- Traditional occupations
- Land ownership patterns
- Colonial policies
## Economic Factors
- Access to education
- Employment opportunities
- Capital availability
## Social Factors
- Caste-based networks
- Marriage patterns
- Social mobility
## Policy Impact
- Reservations
- Land reforms
- Skill development programsNever accept 60%+ for OBCs in agricultural households — actual figure is around 45%
Don't confuse population share with agricultural household share — they differ slightly
SC representation in agriculture matches overall population, but ST is higher due to limited alternatives
General category under-representation in farming indicates better access to other employment